
Before asking ChatGPT or Copilot to analyse a finance workbook, turn the data into one plain Excel table. Every row should name a period and business unit, every amount should name its currency, and the actual and budget columns should have different headers. The tool returns a calculation table and short summary. A finance reviewer then rebuilds the totals with spreadsheet formulas and checks that the tool used the right rows and columns.
That is the standard for a usable finance workbook. An answer can still sound plausible when the tool has read the wrong column or misunderstood a label.
This guide uses a small fictional workbook. The figures are illustrative and are not client data or a claim about ChatGPT or Microsoft Copilot performance.
Start with the question the workbook must answer
Define the decision before changing the spreadsheet. For this example, the controller asks:
Which business units contributed most to the change in consolidated gross margin between the August 2026 budget and actual result?
That question requires revenue and gross profit for the same period, budget and actual scenarios, and business-unit labels. It does not require employee names, invoice details or bank information. Removing unnecessary data reduces confusion and may reduce data-handling risk.
Put one observation on each row
The downloadable example uses one row for each business unit and period:
| Period | Business unit | Currency | Actual revenue | Budget revenue | Actual gross profit | Budget gross profit |
|---|---|---|---|---|---|---|
| 2026-08 | North | USD | 120,000 | 100,000 | 48,000 | 40,000 |
| 2026-08 | South | USD | 70,000 | 80,000 | 19,600 | 24,000 |
| 2026-08 | Services | USD | 30,000 | 20,000 | 18,000 | 12,000 |
The source file also identifies the source system and account-mapping version. These fields help a reviewer determine whether rows were prepared using the same chart-of-accounts mapping.
Avoid decorative layouts in the data sheet. A title spread across merged cells, blank separator rows, subtotals mixed into detail and two header levels may look good in a management pack, but they make the data's structure harder to interpret. Keep presentation sheets separate from the analysis table.
Fix four common workbook problems
1. Merged cells
Replace merged period or entity labels with a value on every applicable row. If “August 2026” appears once above 300 rows, fill the period column for all 300 rows. The table should still make sense when exported to CSV.
2. Unclear or duplicate column names
Use headers such as actual_revenue_usd or separate fields for amount, scenario and currency. Do not use three columns all called “Revenue” and rely on colour or position to distinguish them.
Check for hidden columns and repeated headers inside the table. A model or import process may read them even when a person looking at the visible sheet does not.
3. Account mappings that exist only in someone's memory
If local accounts roll up into management categories, include the mapping table and its version. For example:
| Local account | Management category | Effective from | Mapping owner |
|---|---|---|---|
| 4100 Product sales | Revenue | 2026-01-01 | Group controller |
| 5100 Direct labour | Cost of sales | 2026-01-01 | Group controller |
Keep unmapped accounts visible as exceptions. Do not silently classify them into “Other” simply to make the totals reconcile.
4. Missing currency and unit labels
State whether a number is USD, INR, AED or another currency, and whether the workbook shows units, thousands or millions. For a multi-currency group, retain local amount, local currency, reporting amount, reporting currency, rate and rate date. A consolidated total without this information cannot be independently checked.
Reconcile the workbook before asking for commentary
Use spreadsheet formulas or another deterministic calculation to establish the expected totals. In the fictional example:
- Budget revenue is 200,000 and budget gross profit is 76,000. Budget gross margin is 38.00%.
- Actual revenue is 220,000 and actual gross profit is 85,600. Actual gross margin is 38.91%.
- The consolidated gross-margin change is therefore +0.91 percentage points, subject to rounding.
Gross margin is gross profit divided by revenue. A percentage-point change is the difference between two percentages; it is not the percentage growth in gross margin.
Reconcile each business unit's contribution
For this dataset, calculate each unit's contribution with this formula.
(business-unit actual gross profit / total actual revenue)
− (business-unit budget gross profit / total budget revenue)
The result is:
| Business unit | Contribution to consolidated GM change |
|---|---|
| North | +1.82 percentage points |
| South | −3.09 percentage points |
| Services | +2.18 percentage points |
| Reconciled total | +0.91 percentage points |
The three contributions sum to the consolidated change. This reconciliation is valuable because it makes an incorrect formula visible. It also prevents a common analytical mistake: ranking units only by their own margin change while ignoring their revenue weight.
This attribution answers one mathematical question. It does not establish the business cause. The workbook contains no evidence about price, volume, mix, staffing or one-off events, so an AI-generated explanation of those causes would be unsupported.
Separate margin performance from revenue mix
The contribution table above reconciles the total change, but it combines two effects. An experienced reviewer should also ask whether units improved their own margins or whether more revenue came from higher-margin units.
| Unit | Budget revenue | Actual revenue | Budget margin | Actual margin |
|---|---|---|---|---|
| North | 100,000 | 120,000 | 40% | 40% |
| South | 80,000 | 70,000 | 30% | 28% |
| Services | 20,000 | 30,000 | 60% | 60% |
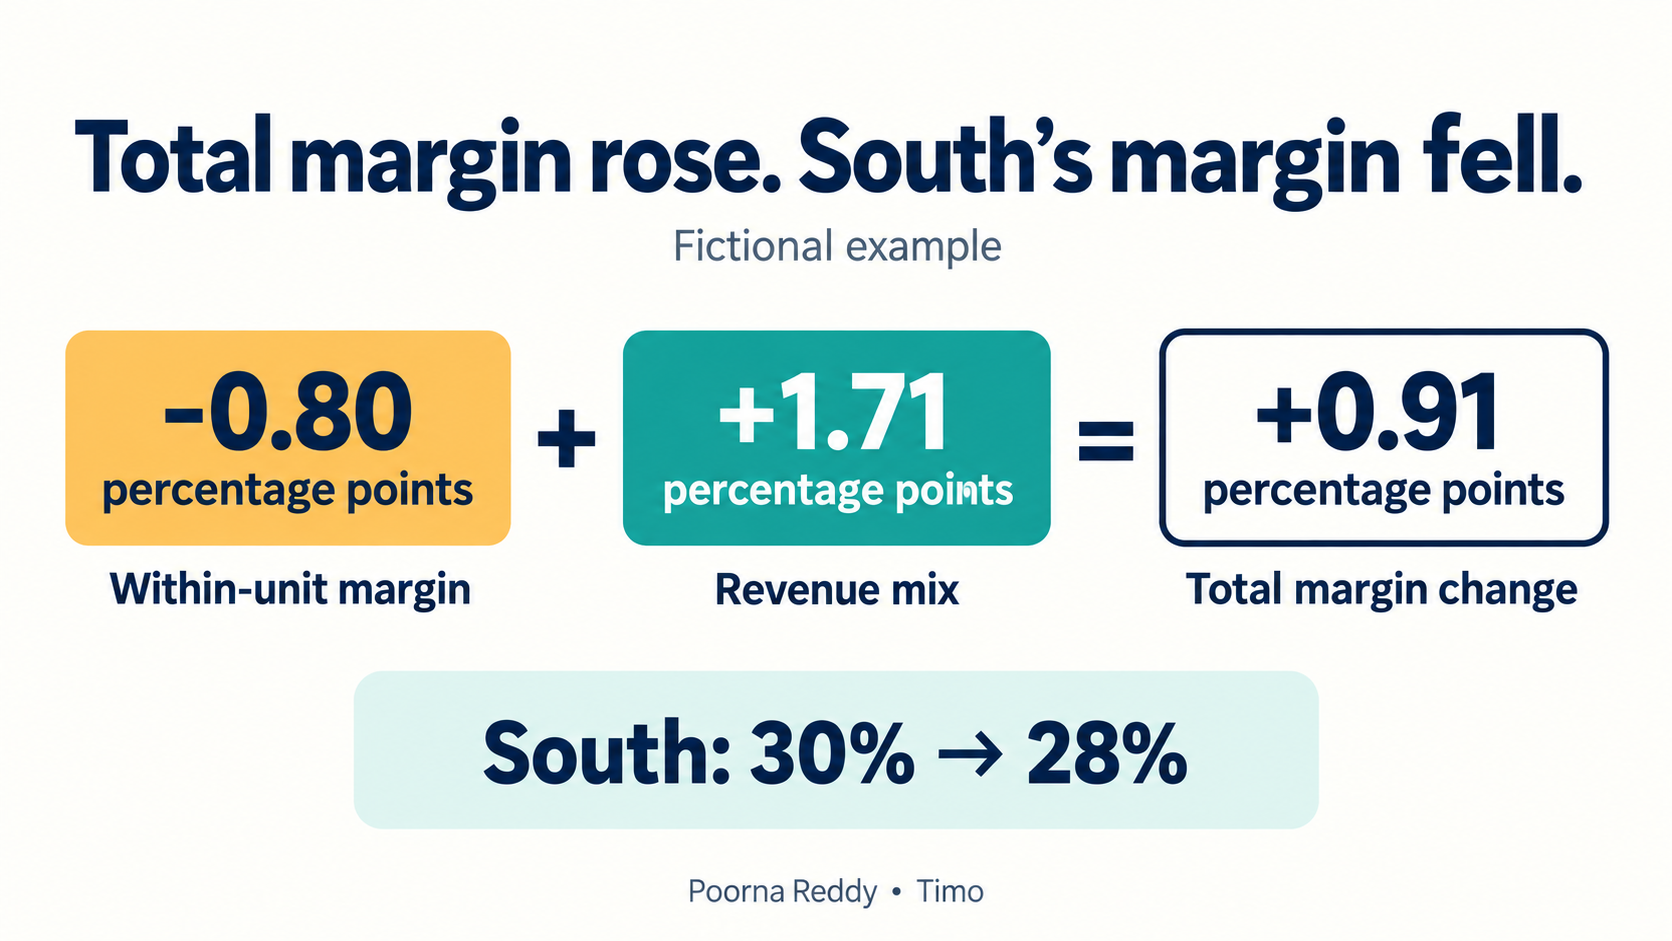
Using budget revenue shares for the within-unit margin effect gives -0.80 percentage points: South's 40% budget share multiplied by its 2-point margin decline. Measuring the revenue-share change at actual margins gives +1.71 points from business-unit mix. Together they reconcile to the +0.91-point total change before display rounding.
The checked conclusion is: “The change in business-unit revenue mix more than offset the adverse within-unit margin movement.” “Profitability improved because every unit performed better” would be false because South's margin declined.
This decomposition does not identify price, volume, customer, discount or cost causes. Those require additional records. A different valid allocation convention can assign the interaction differently, so state the formula and use it consistently across periods.
Tell the tool which figures to calculate
Use your organization's approved product, account and data-handling process. Do not upload a financial workbook until the responsible owner has approved the workspace and the data included.
Then make the request explicit:
You are assisting an FP&A analyst with a fictional August 2026 dataset.

Use only the attached table. Do not infer commercial causes that are not present.

Tasks:
1. Recalculate total actual and budget revenue and gross profit.
2. Calculate actual and budget gross margin.
3. Calculate each business unit's contribution to the consolidated
   gross-margin percentage-point change using the formula below.
4. Return a calculation table and a short factual summary.
5. Mark any missing, inconsistent or ambiguous field. Do not repair it silently.

Formula:
(BU actual GP / total actual revenue)
− (BU budget GP / total budget revenue)

Expected control: business-unit contributions must sum to the consolidated
gross-margin change, subject to stated rounding.
The prompt supplies the task, formula, permitted input and expected total. It does not guarantee a correct answer. The reviewer still checks the output against the workbook.
Check the result before using it
Use this review sequence:
- Row count: Confirm that every expected business unit appears once for the period.
- Column selection: Trace each result to the named actual or budget column. Check that revenue and gross profit were not reversed.
- Units and currency: Confirm that all values use the intended unit and reporting currency.
- Control totals: Recalculate totals and margins with spreadsheet formulas.
- Contribution reconciliation: Confirm that unit contributions sum to the consolidated percentage-point change.
- Mapping exceptions: Review unmapped accounts, new business units and changed account names.
- Narrative support: Remove any cause that is not present in the approved source material.
- Saved file: Save the reviewed output separately. Do not overwrite the approved source workbook with generated values.
Formula tracing is the key discipline. A polished sentence should never be the only evidence for a financial number.
Keep the clean table as part of the monthly finance process
Good structure helps people as much as it helps AI. A table with explicit periods, scenarios, currencies and mappings is easier to review, reuse and audit. The same preparation also makes it easier to compare outputs from ChatGPT, Copilot or a conventional reporting tool while the approved workbook remains the official record.
Download or copy the fictional workbook fixture. Follow Poorna Reddy for more practical AI adoption and financial-workflow examples.